District heating areas in Denmark#
This blog posts demonstrates how to generate a map of the district heating areas in Denmark. Pretty expansive coverage don’t ya think?
Vector data of the district heating areas can be obtained from PlanData.dk. To download the district heating area shapefiles, select “Værktøjer” then click “Download tema” and tick the box “Forsyningsområde, vedtaget”.
import matplotlib.pyplot as plt
import matplotlib.patches as mpatches
import geopandas as gpd
import cartopy
import cartopy.crs as ccrs
import cartopy.feature as cfeature
import os
# Read data using geopandas
df_dh = gpd.read_file("../data/danish_district_heating_areas.shp")

# Only select district heating areas
df_dh = df_dh[df_dh['vaerdi1203'] == 'Fjernvarme']

# Convert to a different CRS
df_dh = df_dh.to_crs(epsg=4326)
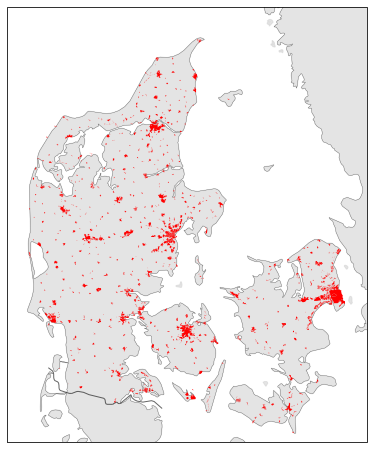
Nation wide#
plt.figure(figsize=(8, 8))

proj = ccrs.PlateCarree()
ax = plt.axes(projection=proj)

ax.add_feature(cfeature.COASTLINE, lw=0.2)
ax.add_feature(cfeature.LAND, alpha=0.6, facecolor='lightgrey')
ax.add_feature(cfeature.BORDERS, alpha=0.6, edgecolor='black')

df_dh['geometry'].plot(ax=ax, facecolor='r')
ax.set_extent([7.8, 13, 54.5, 58])
Copenhagen district heating area#
ctr_kommuner = ['Gentofte kommune', 'Gladsaxe kommune', 'Københavns kommune', 'Frederiksberg kommune', 'Tårnby kommune']
veks_kommuner = ['Glostrup kommune', 'Roskilde kommune', 'Høje-Taastrup kommune', 'Albertslund kommune', 'Brøndby kommune', 'Hvidovre kommune',
                 'Køge kommune', 'Solrød kommune', 'Greve kommune', 'Ishøj kommune', 'Vallensbæk kommune', 'Rødovre kommune']

df_dh_ctr = df_dh[df_dh['cvrname'].isin(ctr_kommuner)]
df_dh_veks = df_dh[df_dh['cvrname'].isin(veks_kommuner)]
df_dh_vest = df_dh[df_dh['forsytekst'] == 'I/S Vestforbrændingen']

plt.figure(figsize=(8, 8))

proj = ccrs.PlateCarree()
ax = plt.axes(projection=proj)
ax.patch.set_facecolor('lightblue')
ax.patch.set_alpha(0.05)

token = os.environ.get('DAGI_DAF_WMS')

ax.add_wms(wms=f"https://api.dataforsyningen.dk/dagi_DAF?service=WMS&request=GetCapabilities&token={token}",
               layers=['Danmark'], zorder=0, alpha=0.8)

params = {'lw': 0.4, 'edgecolor': 'k'}
df_dh_ctr['geometry'].plot(ax=ax, color='orange', **params, label='CTR')
df_dh_vest['geometry'].plot(ax=ax, color='green', **params, label='Vestforbrænding')
df_dh_veks['geometry'].plot(ax=ax, color='lightblue', **params, label='VEKS')
ax.set_extent([11.9, 12.8, 55.38, 55.8])

handles = [mpatches.Patch(color='orange', label='CTR'),
           mpatches.Patch(color='green', label='Vestforbrænding'),
           mpatches.Patch(color='lightblue', label='VEKS')]
ax.legend(handles=handles, loc='lower right', frameon=False, title='District heating supplier')
plt.show()
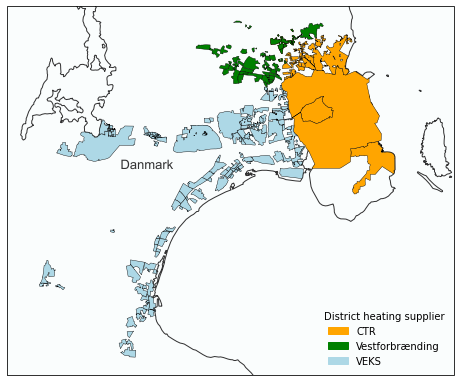
Note the map is not completly perfect. In particular, there are some disconnected district heating areas denoted as VEKS that are in fact separate areas.
Earth as a Rubik’s cube
Solar Energy Systems in Denmark