Posted in 2022
Animation of two-axis tracker shading
- 09 November 2022
In this blog post I’ll show how to create an animation demonstrating self-shading of a two-axis tracker within a solar collector field.
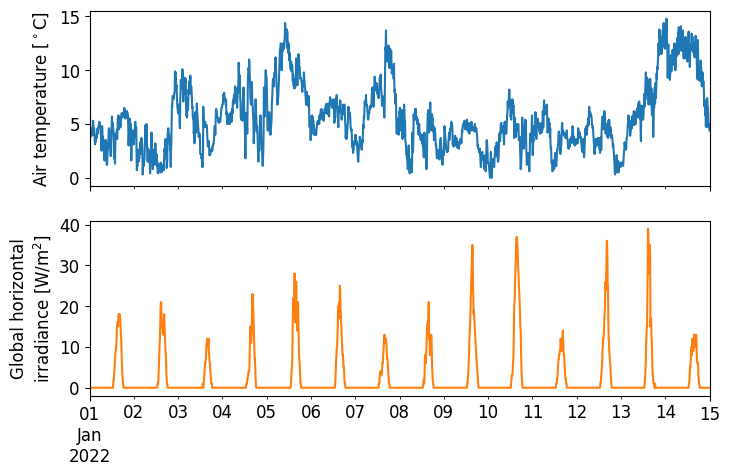
DMI API Tutorial
- 22 February 2022
This tutorial gives an introduction on how to use the Danish Meteorological Institute’s (DMI) API to download meterological observation data (v2).
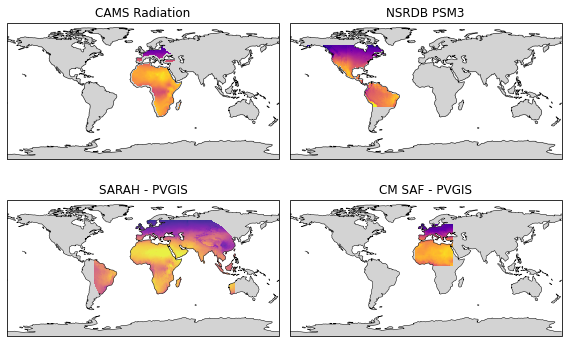
Satellite-derived irradiance maps
- 12 February 2022
Satellite-derived irradiance data has several benefits over ground-measured irradiance despite its lower accuracy. The main advantages include a large geographical coverage (continents), long-timespan (multiple decades), and low cost.
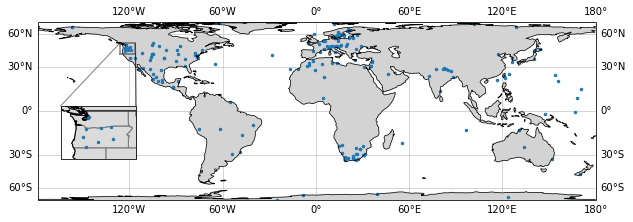
How to add an inset map with Cartopy in Python
- 06 January 2022
You know that small map that shows a zoomed-in view of a part of a bigger map? Well, it’s called an inset map, and according to Wikipedia: