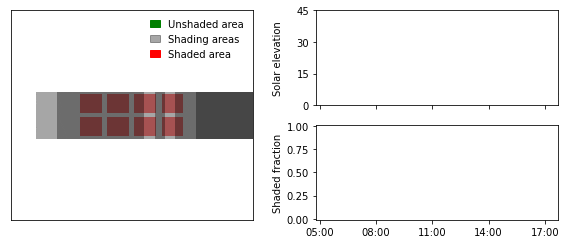
Posted in 2022
Animation of two-axis tracker shading
- 09 November 2022
In this blog post I’ll show how to create an animation demonstrating self-shading of a two-axis tracker within a solar collector field.
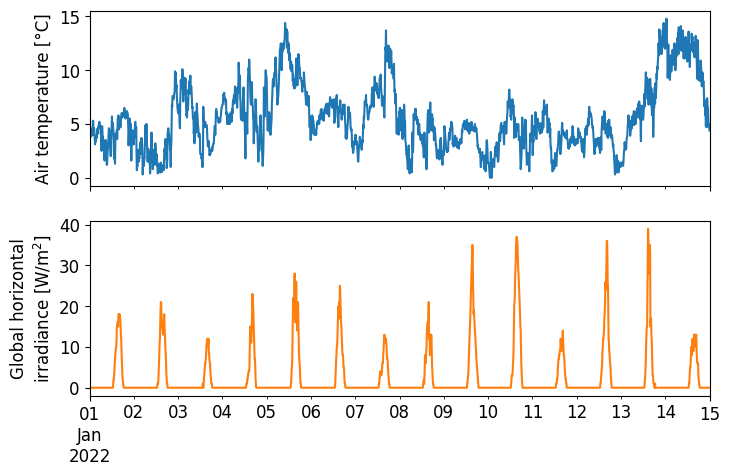
DMI API Tutorial
- 22 February 2022
This tutorial gives an introduction to how to access meteorological observation data from the Danish Meteorological Institute (DMI). Data is retrieved from the meteorological observation data API (v2). Note that these near-real-time observational data are not quality-controlled. Quality-controlled hourly data is available from another API.
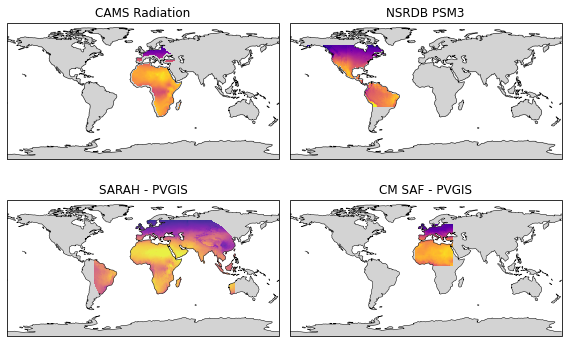
Satellite-derived irradiance maps
- 12 February 2022
Satellite-derived irradiance data has several benefits over ground-measured irradiance despite its lower accuracy. The main advantages include a large geographical coverage (continents), long-timespan (multiple decades), and low cost.
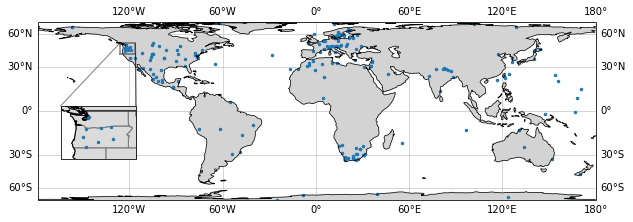
How to add an inset map with Cartopy in Python
- 06 January 2022
You know that small map that shows a zoomed-in view of a part of a bigger map? Well, it’s called an inset map, and according to Wikipedia: